Academic Economics Chart Simulation - Image 1

Image prompt

Academic Economics Chart Simulation

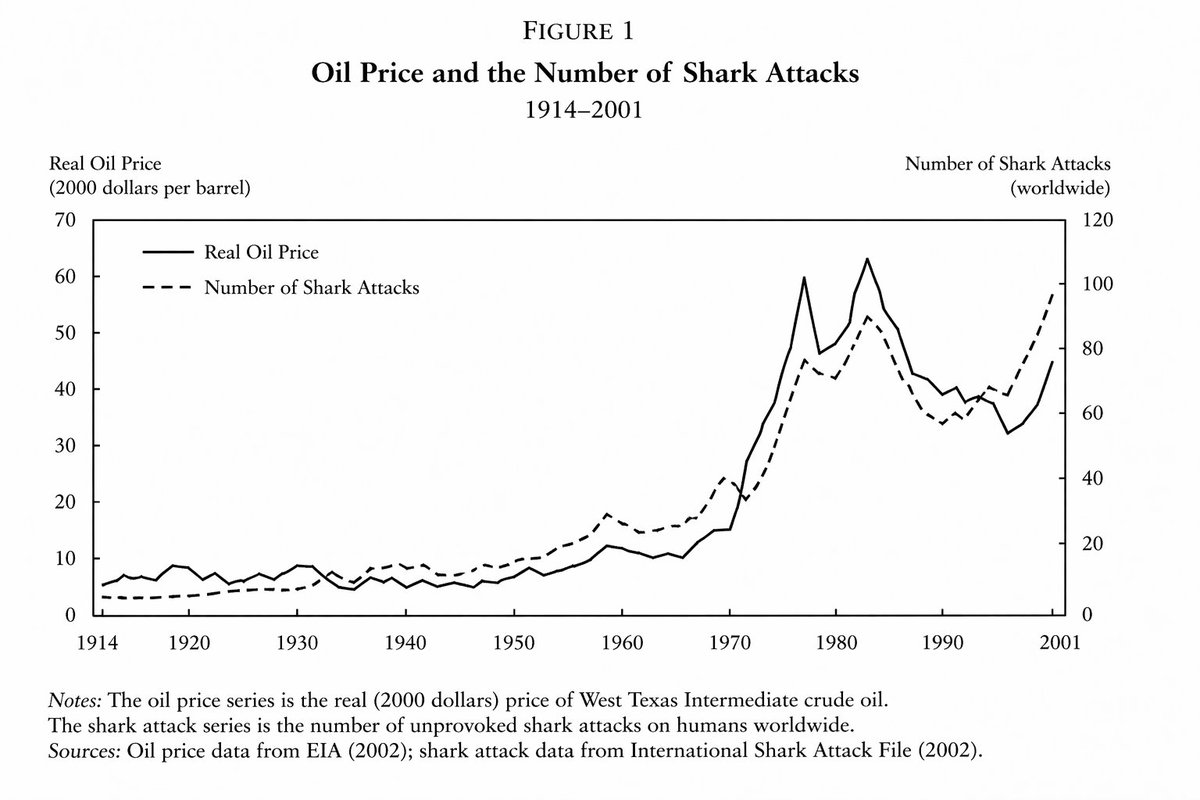
A prompt designed to generate highly realistic but fictitious academic charts, specifically showing a correlation between oil prices and shark attacks in an economics paper style.

Model
GPT Image 2 Prompts
Category
Infographic / Edu Visual
Source
Internal curation
22 views 0 copies 0 try clicks

Full Prompt

Copy directly into the target model and adjust for your input assets.

Back To Library
line graph from an important and prestigious {argument name="field" default="economics paper"} demonstrating a close but not exact relationship between {argument name="variable one" default="the price of oil"} and {argument name="variable two" default="the number of shark attacks"} between {argument name="time period" default="the years of 1914 and 2001"}

Source Record

Original source details are kept for attribution and review.

GitHub source:YouMind-OpenLab/gpt-image-2-prompts-search

This page is adapted from YouMind OpenLab GitHub prompt libraries. License: MIT。